Environmental
performance data
Environmental contributions and impact of ARE Holdings business activities Figures below represent results for FY 2022.

INPUT(FY2022 Results)
Energy Sources
| Electricity | 45.20 million kWh / year |
|---|---|
| Heavy oil | 456kL / year |
| Kerosene | 350kL / year |
| Light oil | 2,606kL / year |
| Gasoline | 769kL / year |
| Urban gas | 2.50million ㎥/year |
|---|---|
| LPG | 57t / year |
| Water | 354,938 ㎥/year |
| Chemicals | 16,115t / year |
OUTPUT(FY2022 Results)
| Waste | 22,694t / year |
|---|---|
| Effluent | 241,809 ㎥/year |
| CO2 | 105,558t / year |
CO2emissions
Compared to FY2015
27%reduction
By FY2030, we aim to reduce CO2 emissions from energy sources by 50% compared to FY 2015.
<Scope of data>
Headquarters, sites, sales offices and plants in Japan, as well as Group companies*, and overseas subsidiaries* (calculation period: April to March)
* The data pertains to consolidated subsidiaries as of March 31, 2023. Data for deconsolidated subsidiaries are subtracted retroactively, while subsidiaries that were previously non-consolidated has been added retroactively, going back to the fiscal year when the subsidiary became consolidated .
OUTCOME(FY2022 Results)

Amount of precious metals recycled
Amount of precious metals recycled in FY2022
Total
207 tons / year
We will expand and promote precious metal recycling globally in order to make more effective use of limited global resources.
Proper Industrial Waste Disposal
Total
344,000 tons / year
We will strive to ensure proper treatment of waste as a waste disposal expert and work to help build a world of sustainable recycling.
CO2 Emissions Reduction from Precious Metals Recycling
The CO2 emissions reduction benefit from precious metals recycling by the Group is calculated as the emissions from its precious metals recycling deducted from the emissions that would have been produced by refining the same amount of precious metals from mined raw material. By expanding our precious metals recycling, we will also be indirectly contributing to CO2 emissions reduction.
(The CO2 emissions reduction figure does not indicate the level of emissions directly reduced by the Group.)

Environmental benefit of precious metals recycling
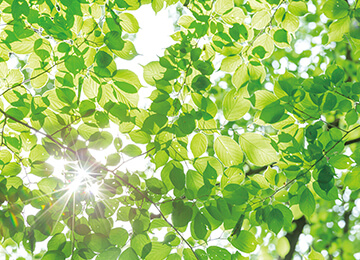
When CO2 savings are expressed as the amount of greenhouse gases absorbed by forests, it is equal to 22,617 hectares of forest (an area about one third the size of Lake Biwa)
22,617 hectares of forest
(an area about one third the size of Lake Biwa)
Note: Calculation was based on the assumption that one cedar tree absorbs 14 kg of CO2 annually (Source: Forestry Agency of Japan), and 1,700 cedar trees are planted in an area of one ha.

538,000 tons-CO2